Updated every 15 minutes
SPX gamma levels today: walls & gamma flip
At 15:59 ET on 2026-10-30, SPX was at 7578.67, 41 points above zero gamma (7538), above the call wall at 7575. Net GEX was −54.19B per 1% move (negative gamma); both walls were on the same strike.
Last session · last update ET
Call wall
7575
The strike carrying the most call-side gamma, at or above zero gamma.
Put wall
7575
The strike carrying the most put-side gamma, at or below zero gamma.
Zero gamma / gamma flip
7538
The price at which modelled net dealer gamma changes sign.
Max pain
7780
The strike where total option payout at expiry is smallest.
Spot 7578.67 · net GEX −54.19B per 1% move · walls and zero gamma from the open-interest book, SPXW 0DTE
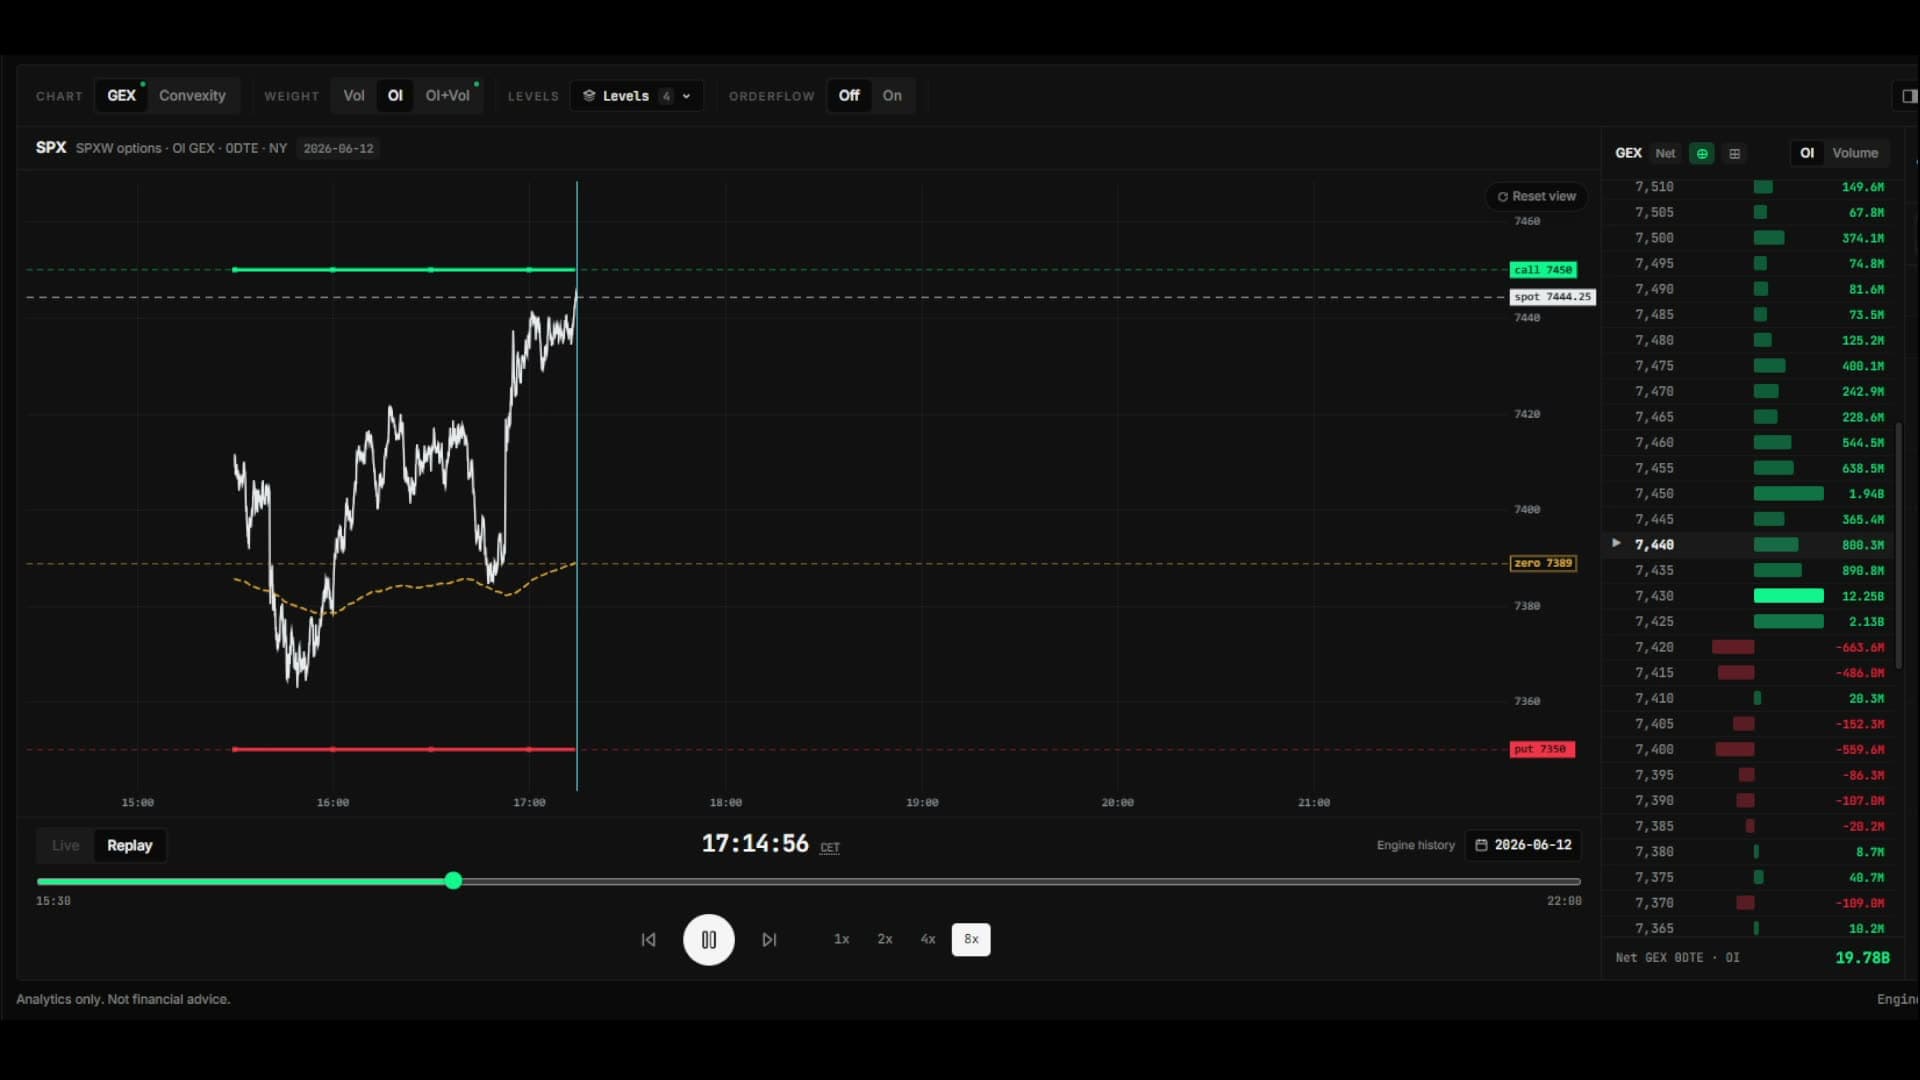
The four numbers above are the headline, free and without an account. The strike ladder and session replay are in the product: 30-day replay from $24/month on Starter; 90 days and the volume book on Pro at $49/month.
Questions
- Where do these SPX levels come from?
- From the SPXW 0DTE option chain. GammaTape computes Black-Scholes gamma per strike and weights it by open interest. The call wall is the strike with the most call-side gamma at or above zero gamma, the put wall the strike with the most put-side gamma at or below it, and zero gamma is the price at which net GEX changes sign, nearest spot. The numbers on this page are the open-interest book; the engine recomputes them every 3 seconds during the session.
- How often does this page update?
- Every 15 minutes. The dashboard updates every 3 seconds — this page is a snapshot of the same engine, published without an account. The line under the read says when the numbers were computed.
- What do the call wall and the put wall mean?
- They are the strikes where modelled dealer gamma is heaviest on each side of zero gamma, which is where dealer hedging is most concentrated. They describe positioning at the time shown; they are not a forecast of where price will turn.
- Why is SPX relevant if I trade ES?
- ES is a future on the S&P 500, the index SPX options are written on, so SPX positioning is the options book behind ES. On an ES chart the same levels sit one basis away (ES minus SPX), which moves through the session. The ES page publishes them in SPX index points and explains how to read them on ES.
Market analytics, not investment advice. Levels describe options positioning; they are not a forecast. See the methodology for how each level is built, the glossary for what each term means, or the GEX calculator for the arithmetic behind one strike.