Updated every 15 minutes
QQQ gamma levels today: walls & gamma flip
At 15:59 ET on 2026-10-12, QQQ was at 745.97, $2.49 below zero gamma (748.46), below the put wall at 746.00. Net GEX was −2.51B per 1% move (negative gamma); the two walls were $4.00 apart, 0.54% of spot.
Last session · last update ET
Call wall
750.00
The strike carrying the most call-side gamma, at or above zero gamma.
Put wall
746.00
The strike carrying the most put-side gamma, at or below zero gamma.
Zero gamma / gamma flip
748.46
The price at which modelled net dealer gamma changes sign.
Max pain
751.00
The strike where total option payout at expiry is smallest.
Spot 745.97 · net GEX −2.51B per 1% move · walls and zero gamma from the open-interest book, QQQ 0DTE
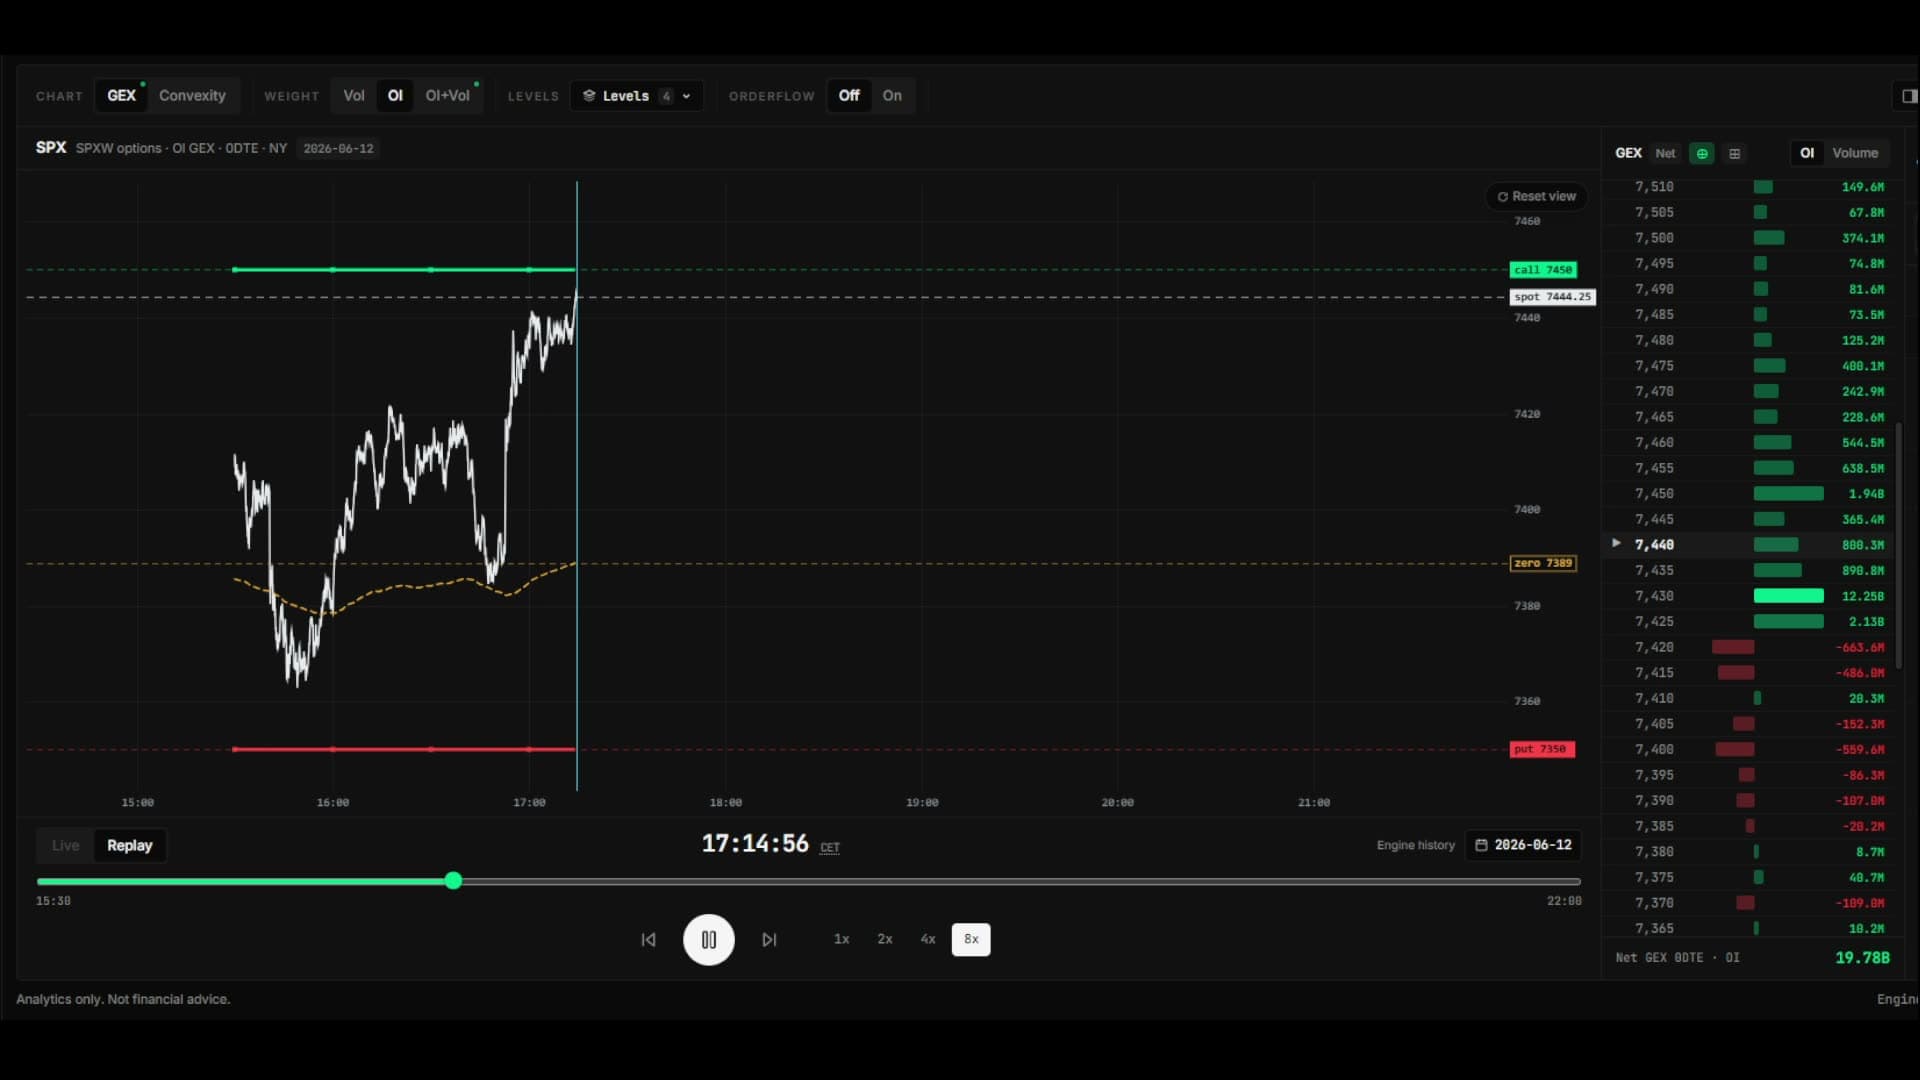
The four numbers above are the headline, free and without an account. The strike ladder and session replay are in the product: 30-day replay from $24/month on Starter; 90 days and the volume book on Pro at $49/month.
Questions
- What are QQQ gamma levels?
- They are the strikes where modelled dealer gamma concentrates in the QQQ 0DTE option chain. The call wall is the strike carrying the most call-side gamma at or above zero gamma, the put wall the most put-side gamma at or below it, and the gamma flip — zero gamma — is the price at which net GEX changes sign. They mark where dealer hedging is most concentrated on the Nasdaq-100 ETF book.
- How do QQQ levels relate to NDX and NQ?
- All three track the Nasdaq-100. QQQ and NDX are separate option chains held by different participants, so their walls need not land on matching prices. GammaTape's NQ levels come from the NDX chain, not from options on the future; the NQ page publishes them in NDX index points.
- Is QQQ positive or negative gamma right now?
- The net GEX figure above answers it as of the update time shown. Positive means dealers are modelled net long gamma, so their hedging trades against the move; negative means they are modelled net short gamma, so their hedging trades with it. The sign changes at zero gamma, also shown above.
- How often does this page update?
- Every 15 minutes. The dashboard recomputes the same numbers every 3 seconds — this page is a public snapshot of the same engine, published without an account.
- Why look at QQQ gamma if I trade NQ?
- QQQ carries a separate, largely retail options book on the same index as NDX. Reading it next to the NDX levels shows a second picture of Nasdaq-100 positioning; the walls and zero gamma on this page are its open-interest book.
Market analytics, not investment advice. Levels describe options positioning; they are not a forecast. See the methodology for how each level is built, the glossary for what each term means, or the GEX calculator for the arithmetic behind one strike.