The GEX profile is not a price chart. It is a strike-by-strike inventory of dealer gamma — usually shown as a ladder with Net GEX bars left (negative) and right (positive). GammaTape shows Volume and Open Interest side by side so you can see the structural book and the intraday rewrite at the same time.
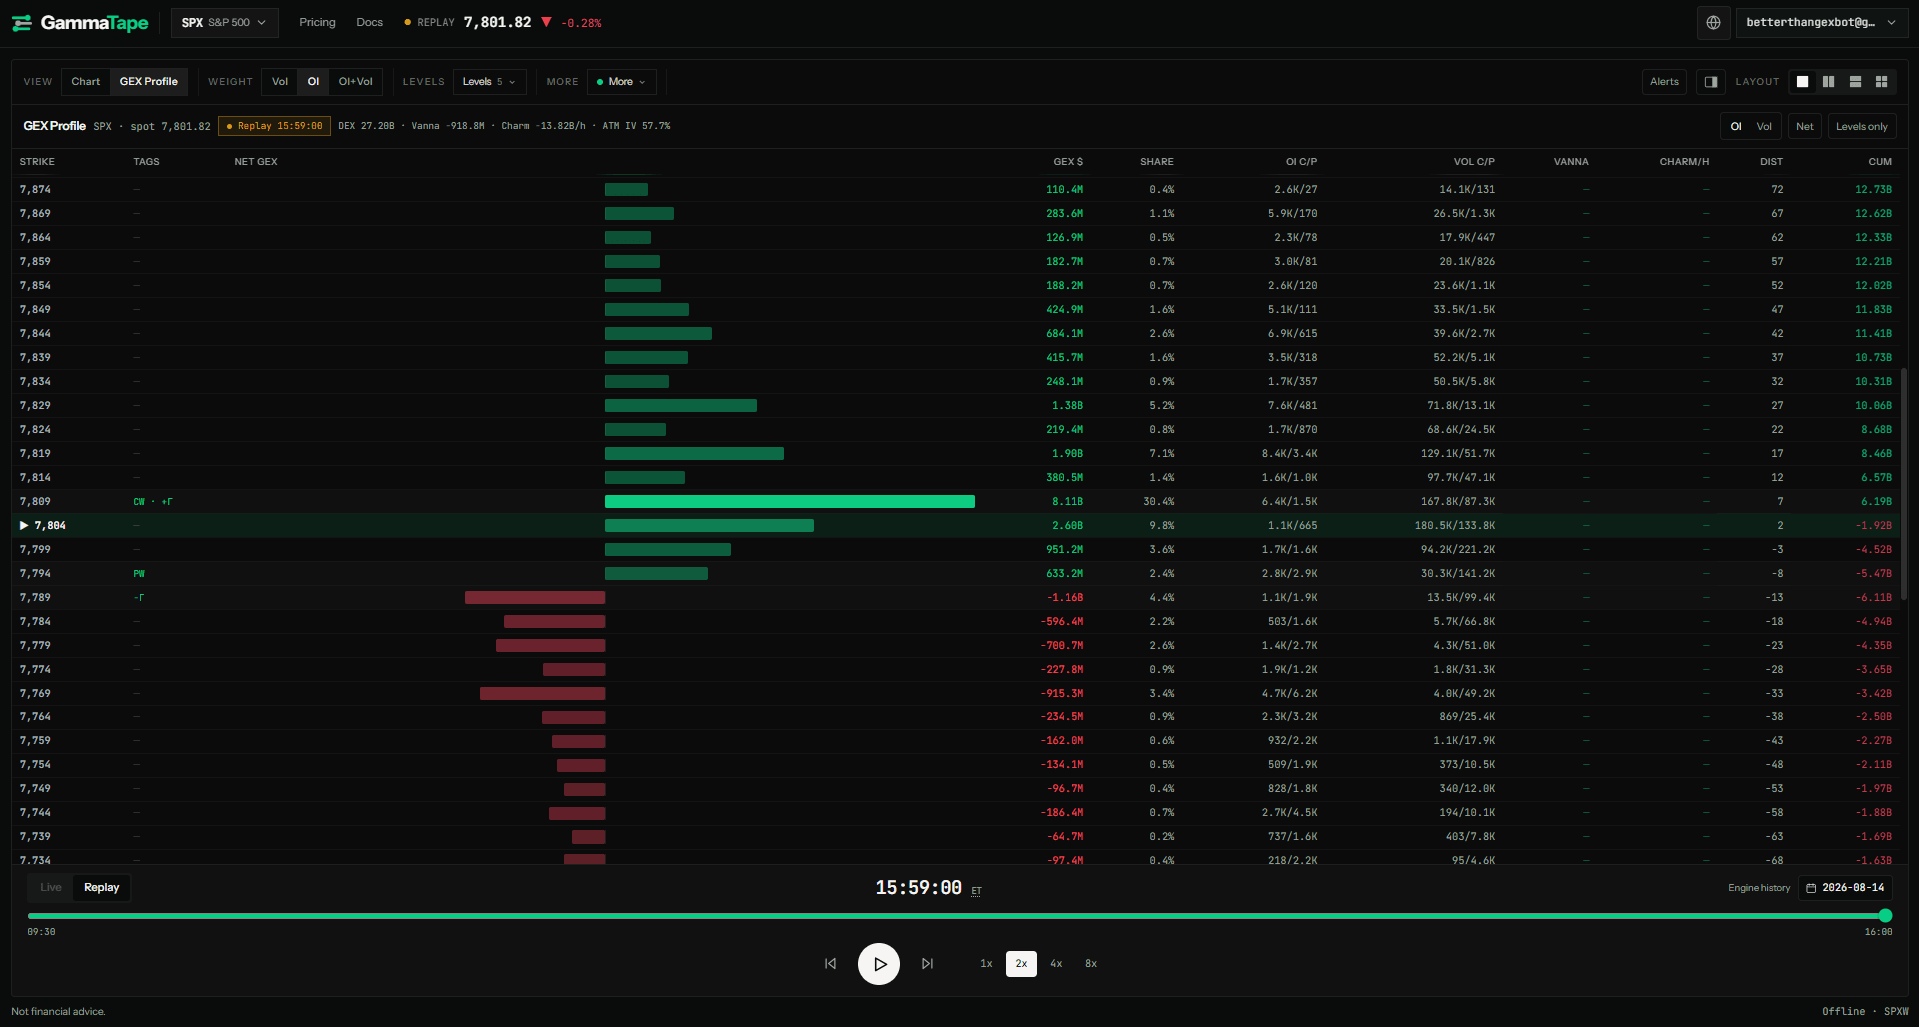
What each column means
- Strike — the option strike in index points (SPX/NDX/ETF).
- Net GEX bar — green to the right is positive gamma at that strike; red to the left is negative.
- Spot marker — the arrow/row nearest cash. Walls above and below are read relative to that row.
- Footer Net GEX — sum of the book for that weighting (Vol or OI).
Why Vol and OI disagree
OI GEX is the standing book — yesterday’s open interest still matters at the open. Volume GEX rebuilds as the session prints. Midday, volume can invent a wall that OI never had; late day, OI can still dominate if flow is thin. Treat disagreement as information, not a bug.
A simple RTH checklist
- Find spot on both ladders.
- Note the nearest call wall (largest positive call-side cluster above spot) and put wall below.
- Compare Vol vs OI: if Vol has already flipped a wall and OI has not, the map is mid-rewrite.
- On ES/NQ, shift by your basis — the relative structure matters more than the absolute index print.